CSI
PA09
Tracking the Greats of the NBA
Code due by Wed, 11/20 at 11:59pm
The purpose of this assignment is to give you more practice with functions, files, and lists while using a real data set populated
with career data from NBA players!
Remember, before you begin this project, review the function commenting styles
that I expect. This includes comments specifying inputs/outputs and the descriptive docstring. Please create the function comments before beginning the actual
coding.
This is a big assignment! Start early!
Getting Started
Download one of the following csv files formatted for your computer:
- player_career.csv
- player_career_mac.csv
The format of this file is easy to understand. Open the file by right
clicking on the file and selecting "Open With" and selecting a text editor of
some kind like Notepad++ or Wordpad. The first line tells you the names of all
the columns (To understand the meanings of each of the abbreviations, look at this page).
After that, each
line's data corresponds to one player's career statistics. Each field is
separated by a comma.
Notice that, in addition to the very first line, which is the header
information, there appears to be a blank line followed by a line of "garbage" at the bottom of the
file. This will become an issue later in the assignment.
I've decided to give you all one more assignment where I specify exactly what functions to create in case you are having troubles following your design from homework 8. You can choose to use my design or your design from homework 8. Either way, make sure the entire program starts when the autolab calls your main() function with no inputs.
At the end of
this assignment, take a look at your design tree compared to the design I give
you below. I'll want you to write a few paragraphs (Part 4 below)
comparing my design to yours.
Your Assignment, Part 1
- Begin by creating a file called pa09.py.
- In this file create a function called readData(). This
function should:
- take in a single parameter that is the file name you want to read.
- open the file.
- each line in this data file should be read as a list, and then each line
list should be then appended to a master data list.
- you should ignore the "garbage" rows from the player_career.csv
file and not add those lines to your list.
- close the file
- return the master data list, which is a list of line lists. (In other
words, you should return a list of length 4051. Each element in the list is
itself a list representing the career stats of a single player)
- the function should look something like this:
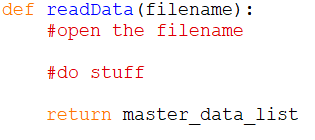
- Note: If you try to print this master_data_list, it is so big that the print buffer may eat up all your memory and stall your program. To make sure you are creating the list right, make a copy of the input file and delete all but the first 10 lines in notepad or textedit. Now the list will be small enough that it can be printed.
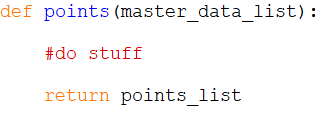
- Write a function called points(). This function should:
- take in one parameter - a list of player data (this
will be the data you "loaded" and "cleaned" using readData())
- For each player in the data list you should create a
list consisting of the points the player earned and the player's name)
- Each of these lists should be appended to a separate
list.
- When you are done processing the input data you should
return this new list of lists.
- The function should look something like this:
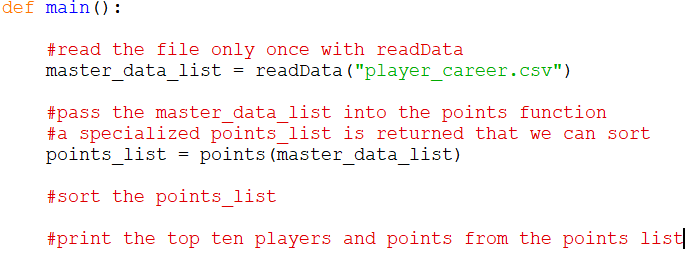
- Write a function called main(). This function
should:
- take no parameters
- invoke readData() to get the data about all of the
players from our stat file
- send the list returned by readData() to points()
- sort the list returned by points() to identify and
print information about the ten players from this data file who scored the most points during their careers.
- The function should look something like this:
When you are all done you should be able to load and
invoke main() from the shell and get a response that looks like the
following:
Your Assignment, Part 2
- Write additional functions called minutes() and
freethrows(). These functions should work just like the points() function does.
That is, they should take in the main data list, process each player in the
list to make appropriate lists, and return a list of these lists.
- You should also modify your main() method so
that it prints the ten players with the largest number of each of these items.
When I run this function I should see a long screen dump of the top 10 players
in each of these three statistic categories:
Your Assignment, Part 3 - The Efficiency Statistic
Each of the above statistics is interesting, but it only tells us how good a
player is at one specific statistic. How do many NBA coaches quickly evaluate a
player's overall game performance? They check his efficiency. This statistic is
something like the QB passer rating we calculated earlier in the course. It is
a calculation that tries to assign a number to how "well" a player played the
game. Higher numbers mean a better performance from that player.
NBA.com evaluates all players based on the efficiency formula indicated below
(and shown on the aboutstats.htm page). In this project, we will follow this
efficiency formula. Since we are not evaluating a player based on one game, we
need to divide the total efficiency by the number of games the player played.
So the formula is:
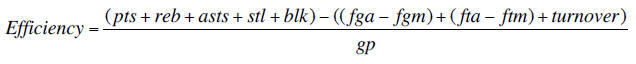
The abbreviations on the right hand side of the equation correspond to the
fields in the statistics file. Again, you can check out the the meanings of
each of the abbreviations at:
http://www.databasebasketball.com/about/aboutstats.htm
- Create a function called efficiency(). This function
should behave very similarly to the functions you wrote in parts 1 and 2 in
that it should:
- take in one parameter - a list of player data (this
will be the data you "loaded" and "cleaned" using readData())
- For each player in the data list you should create a
list consisting of the player's career long efficiency and the player's
name)
- Each of these lists should be appended to a separate
list.
- When you are done processing the input data you should
return this new list of lists.
- Now modify main() so that it uses this as it
has the prior functions.
Your Assignment, Part 4 - Design
This design tree would have 6 modules, one for each function -- main, readData, points,
minutes, freethrows, and efficiency. Compare this design
with the design tree you created in homework 8, and write two paragraphs stating:
- the differences between this design and your design tree
- what you would change in your design tree now that you've implemented the program
Helpful Hints:
- Remember the split() function, which takes as an argument the character to
split on, and returns a LIST of STRINGS
- Pay attention to the type of data you are working with. Don't forget
to convert Strings to numbers or vice versa as needed:
- A 2-item list would be:
mylist = [x,y]
To append this list to a list you can just say myList.append(mylist). Then
to access the
different items in the list you index into the list twice, so for example if
you appended the
above list as the first item in a list:
myList[0][0] would return x
myList[0][1] would return y
- Since there are so many fields, do some testing (E.g. output some parsed
data) to
make sure that you get the correct data.
- List�s sort function and reverse function should be useful.
-
myList = [ [3,2], [1,2], [2,5]]
myList.sort() # myList will be [ [1,2], [2,5], [3,2]]
myList.reverse() # myList will be [ [3,2], [2,5], [1,2]]
Final Submission
Please upload your program and paragraphs to the program submission system. The program is worth 20 points, and the paragraphs are worth 5 points. The submission system will not autograde your paragraphs (I will do that manually at a later time). The program submission system will be running your main function and will give you more points for each top 10 list you are able to generate.