Assigned on Friday, October 7th, 2011
Due on Friday, March 14th, 2011
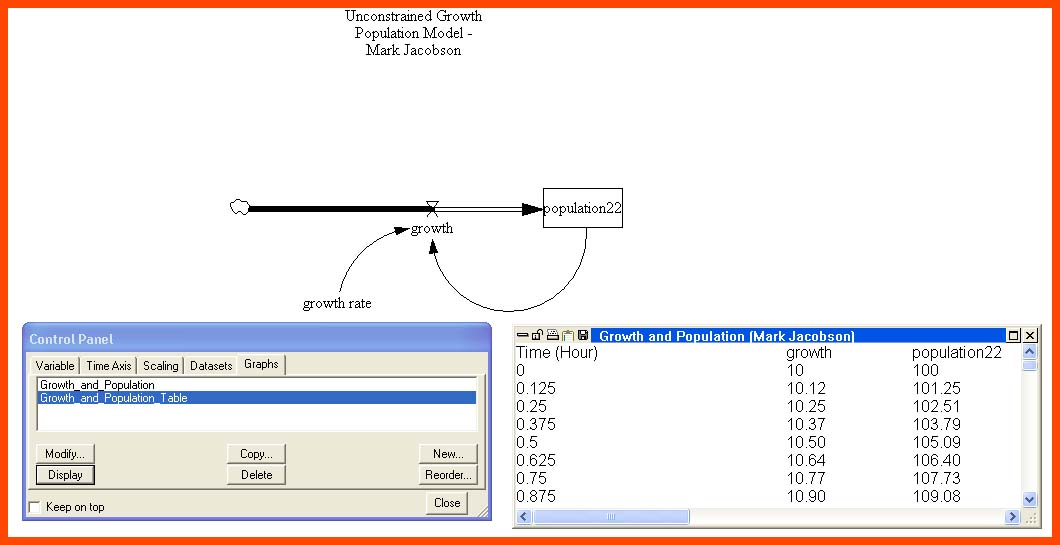
You should also send an attachment of the GRAPH and of the TABLE, that you have inserted (Copied and Pasted as shown in class) into a Microsoft Word document. If you have trouble with that, just print out the TABLE and the GRAPH or see me before or after class for help on that part.
Your graph and table will be of the births, deaths, and population. The TABLE does not have to include ALL of the rows. Just the first 5 or 10 rows and the last 5 or 10 rows would be enough. It should be clear from the assignment handout, which shows what my graph and my table looked like.
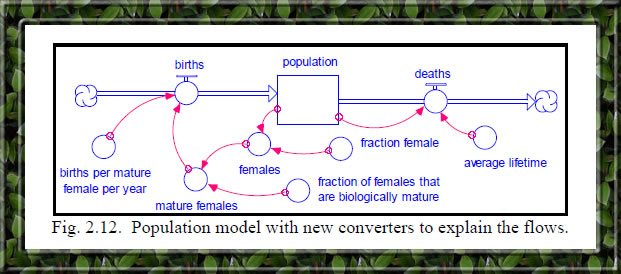
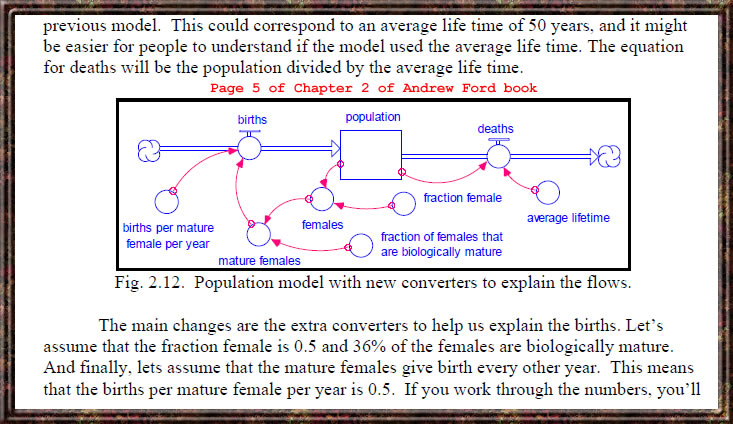
This Model is developed on pages 01 to 06 of that chapter 2 PDF.