- Here is an example of the general setup for your Monte Carlo assignment:
How large should the enclosing rectangle be? What is the width of the rectangle? What is the height of the rectangle?
What formula will be used to generate a random x value, given the width of the rectangle and the range of x values you need?
What formula will be used to generate a random y value? Look at the height of the rectangle and the range of y values you need. PI is 3.14159 and 5 decimal places is enough precision.
- The Excel spreadsheet saved from Excel as an HTML document.
Also VIP: See the Excel spreadsheet with the FORMULAS SHOWING to better understand the
Excel SIN function and other operators used.
- See the Excel formulas that were used: Show Formulas for f(x) and g(x). Relative Cell references to column A are used.
- Fall 2009: Excel Monte Carlo resources and assignment from November 2009.
- Why study trigonometry? Sine and Cosine applied to motion graphics: Adobe After Effects special effects using SINE and COSINE.
- Physical Simulations: Sine and Cosine
- Exponential Growth (folding paper in half 50 times), Exponential Decay, combining Adobe After Effects Expressions language functions Math.exp() with Math.sin() to create a model of a decaying sine wave. Note: Adobe Flash ActionScript 3.0 uses Math.exp() and Math.sin() too.
- From pendulums to squash and stretch. Applications of SINE waves combined with EXPONENTIAL decay via Math.sin() and Math.exp(). Squash and Stretch is one of the most important techniques used in animation. Springing and bouncing examples too.
- 3D SINE waves. Undulating Grid example - 3D via x and y and z is related to R and G and B.
VIP: Reread Introduction and Chapter One of the Geduld book after looking over the above material. The After Effects Expressions language will start to make sense only AFTER you have been confused by it, so do not hesitate to look into it frequently. These PDFs are FREE. Other material will be provided by handouts and video tutorials. See GeduldBookIntroAndChap01.html and as you skim through it, take some notes or write down some questions.
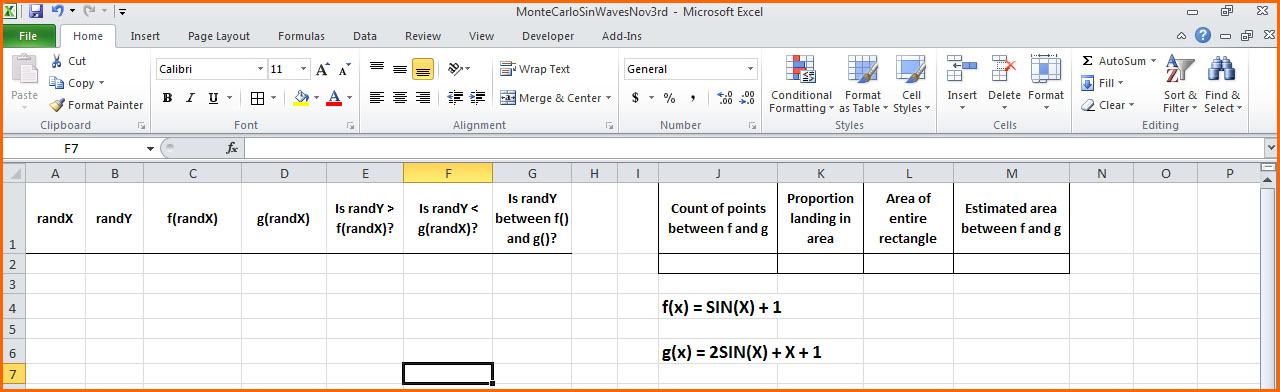
- Camtasia Video tutorial on how to perform the Monte Carlo simulation and find the area between the two function f() and g() for values of x from 0.0 to 2*3.14159, i.e. from 0 to 2PI. This tutorial will demonstrate how to do everything you need to do to create the Excel model that simulates "throwing darts" to get an estimate of the area between two functions. (NOT READY YET - should be ready by late Tuesday evening in time for Wednesday's class).
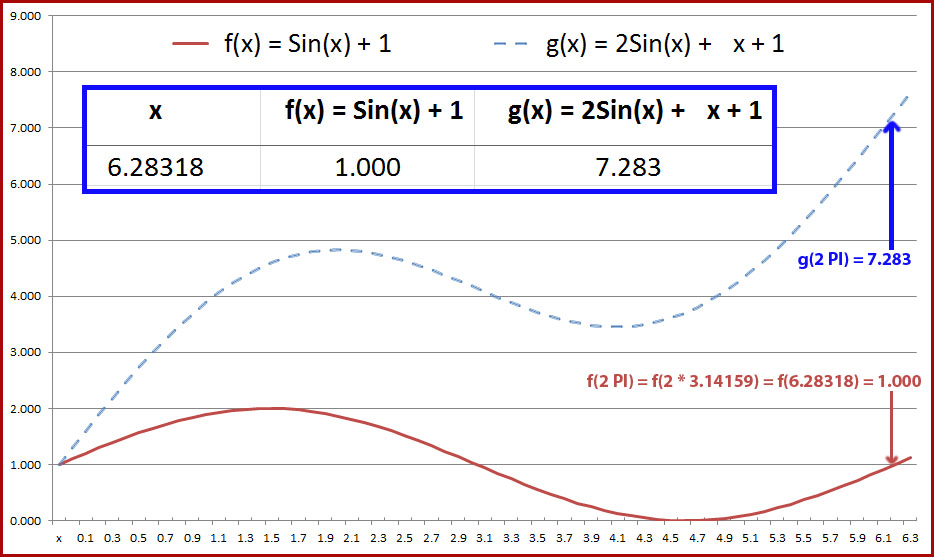
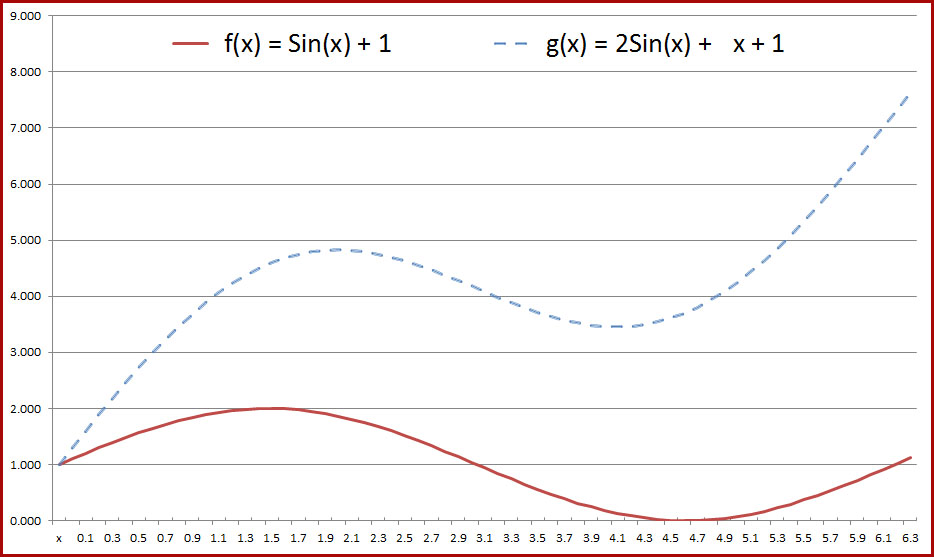
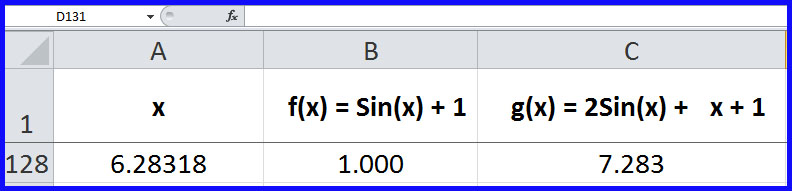
- The rectangle that we will throw darts into will go from 0 to 6.28319. Note that 2 PI = 2 * 3.14159 = 2 * 3.14 + 2 * 0.00159 = 6.18 + 0.00318 = 6.18318 = 2 PI. What is the Excel formula for generating a randomX value for the dart's location?
- What should be the HEIGHT of the rectangle that we throw darts into? Why is there more than one correct answer for this? Given your answer as to the height, what should be the Excel formula for generating a randomY value for the dart's random landing location in the rectangle?
- How will we know a "dart" landed inside the area, i.e. above function f() and below function g()? Study the previous semester's examples to see how this was done.