PDF of questions on NetLOGO GAME of LIFE model, NetLOGO OIL Percolation Cellular Automata CS model, and some NetLogo show the output questions.
x y
----------- -----------
20.44712727 20.51518572
16.71315584 15.42506731
17.99293085 16.15964686
23.362533 22.79563739
24.9267934 22.01796826
18.55425506 18.20021532
23.79604137 21.90370105
19.86663545 17.55227197
19.1290307 19.0699128
21.91487095 22.91732607
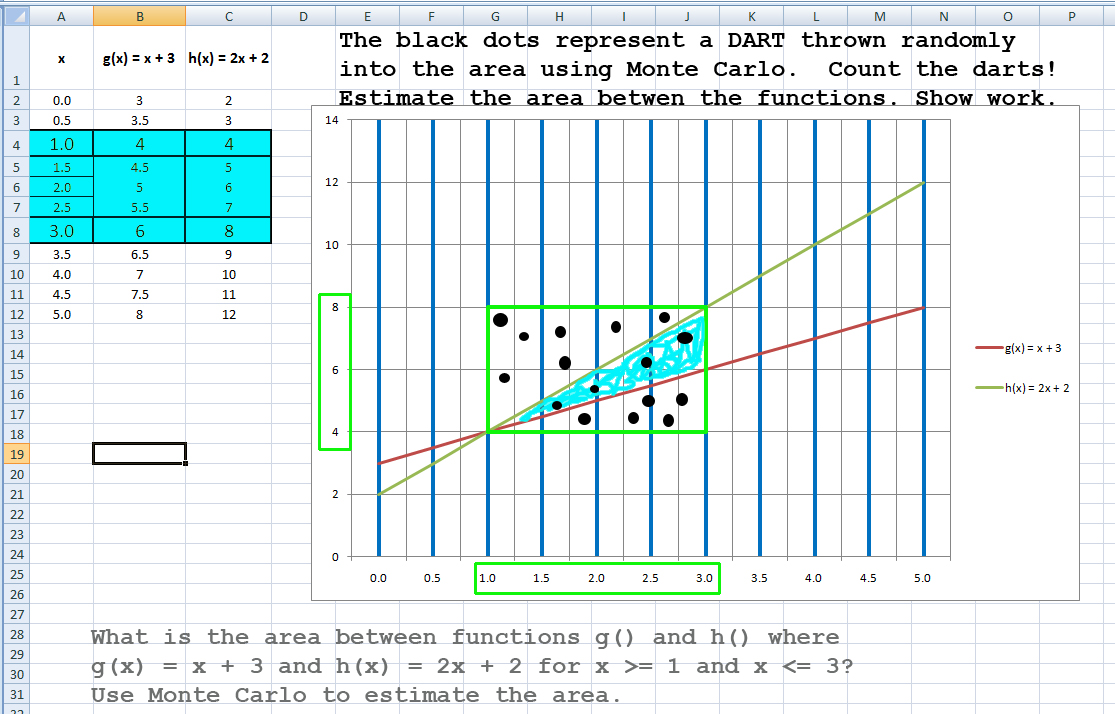
y = mx + b or in Data Flyer f(x) = m * x + b
What is m? _________________ What is b? _________________
What is the Sum of squares of deviations that you found?
What is the output you would see on the NetLogo grid
after running the ExampleOne procedure?
   (Draw a rough picture of about what it would look like).

 TO ExampleOne
     ca
     cro 8

     ask turtles [
         fd 5

         pd
         fd 5

         pu
         fd 2

         pd
         fd 2

         pu
         fd 2
     ]
 END
Show what the screen or the NetLogo grid would probably look like AFTER the following procedure ExampleTwo finishes.
           (Note: there may be many possible drawings that get full credit for this
                  question.   You will NOT be told this on the exam, but you are being
                  told this for this study guide).  CRO versus CRT - VIP to know!
TO ExampleTwo
    CA
    CRT 8

    ask turtles
    [
        PD
        FD 8
    ]
END
to randomColorPatches

   ask patches
      [
         ifelse random  100 < 30
             [ set pcolor green ]    ;  Note: you might be asked to show the output of a NetLogo procedure that
             [ set pcolor white ]    ;        included an ifelse, so be sure to understand how ifelse is used in this example!
      ]
end
SHOW THE OUTPUT, roughly what it would look like when stagger is done.
to stagger
    ca
    cro 8
    ask turtles [ifelse remainder who 2 = 0  [ fd 5  wait 0.2]
                                             [ fd 10 wait 0.2] ]
end
Just draw a picture of what the NetLogo window would look like after execution of stagger3 is done.
Copy and Paste the NetLogo code into your NetLogo if you want to see what the output looks like and verify you figured it out.
to stagger3
   ca
   cro 15
   ask turtles
       [ ifelse remainder who 3 = 0

              [ fd 5 wait 0.1]                ; the remainder was 0

              [ ifelse remainder who 3 = 1    ; remainder was NOT 0

                      [fd 10 wait 0.1]    ; the remainder was = 1

                      [fd 15 wait 0.1]    ; the remainder was = 2
              ]
       ]
end
See the application with the two bouncing balls. RED uses Ease In and Ease Out to be a better model and simulation. GREEN does NOT use any easing in or easing out. Green Ball moves at a constant speed.
For the SHODOR Data Flyer application: Ease In, Ease Out, No Easing frame by frame locations of the ball moving from y = 20 to y = 380 over 10 frames.
Example: The Flash bouncing ball with Ease In and Ease Out and without Ease In and Ease Out (not easing). What does the graph look like for EASE IN? For EASE OUT?