CS 1025 Computational Modeling and Simulation

Test One Study Guide - FALL 2013 - Monday, October 21st

Spring 2014 TEST TWO - see #1, #2, #3, and #11 for 04/22/2014 exam practice.


See especially #1 and #2 and #11 
     for the NetLOGO Game of LIFE model 
           concepts and 
                  sample practice questions from previous tests.

See especially #3 on Monte Carlo throwing darts 
     to estimate the AREA of a region:
  i.
 ii.
iii.                         b
 iv.                   a = ----- d
  v.                         c
 vi.


  1. Scanned in Handouts and old test/quiz pages: Please IGNORE the last two pages (oil spill percolation model we have NOT covered in class yet this fall).

    The above is a PDF of questions on NetLOGO GAME of LIFE model along with NetLogo show the output...

  2. The Game of Life model: http://ccl.northwestern.edu/netlogo/models/Life...

  3. Monte Carlo throwing darts to estimate the AREA of a region.

    1. Worksheet done in class: Monte Carlo With NetLogo... Answer questions 1, 3, and 4.

    2. Tossint FRUIT Treats: What do we know? What is the GOAL? What is the formula? What part of the formula is the unknown?

    3. Monte Carlo quiz: Twenty Darts in a rectangle. What is the estimated area of the OVAL?

    4. Draw an Oval application... Cows and Houses and checkerboard on or off of patches.

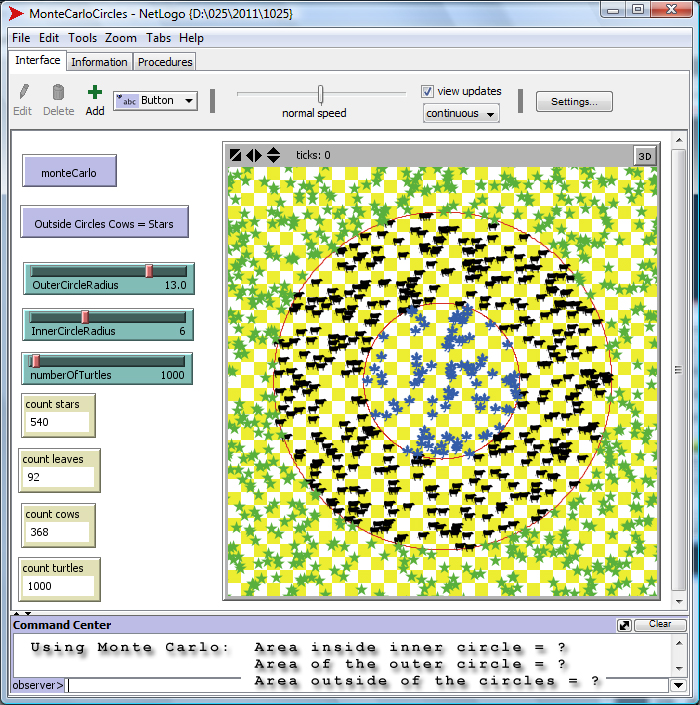
    5. Area between two circles: Another example using NetLogo. Stars, Leaves, and Cows.

    6. MonteCarloCircles.jpg screen Photoshopped snapshot.

      This problem sheet refers to the above JPEG snapshot and goes beyond the basics. You can do questions 1, 2 and 3 but do NOT worry about the material after that.

  4. In NetLogo, show what the output would look like for the following:
  5. What is the output you would see on the NetLogo grid 
    after running the ExampleOne procedure?   
       (Draw a rough picture of about what it would look like). 
             
     TO ExampleOne
         ca
         cro 8
         
         ask turtles [    
             fd 5
        
             pd 
             fd 5
       
             pu
             fd 2
         
             pd
             fd 2
        
             pu 
             fd 2
         ]
     END     
    
  6. Same question as above. Show the output of ExampleTwo procedure.
  7. Show what the screen or the NetLogo grid would probably look like AFTER the following procedure ExampleTwo finishes.
               (Note: there may be many possible drawings that get full credit for this
                      question.   You will NOT be told this on the exam, but you are being
                      told this for this study guide).  CRO versus CRT - VIP to know!
    TO ExampleTwo
        CA
        CRT 8
        
        ask turtles 
        [
            PD
            FD 8
        ]   
    END
    
  8. With regard to the world of NetLogo, what is a TORUS setting for the grid of patches? Looking at some output, be able to describe whether the world was a TORUS, or wrapped just horizontally, or if it wrapped just vertically. Recall in class how a sheet of paper could demonstrate a grid world wrapping vertically OR wrapping horizontally, but its hard to show it doing both..
  9. What does the following NetLogo code produce as output?
    to randomColorPatches
       
       ask patches
          [
             ifelse random  100 < 30 
                 [ set pcolor green ]    ;  Note: you might be asked to show the output of a NetLogo procedure that 
                 [ set pcolor white ]    ;        included an ifelse, so be sure to understand how ifelse is used in this example!
          ]
    end
       
  10. Show the output (generally what it would look like). This question tests one of your old assignment questions, the one where the EVEN and the ODD turtles did different things .

    SHOW THE OUTPUT, roughly what it would look like when stagger is done.

  11. to stagger
        ca
        cro 8
        ask turtles [ifelse remainder who 2 = 0  [ fd 5  wait 0.2] 
                                                 [ fd 10 wait 0.2] ]
    end
    
  12. SHOW THE OUTPUT, roughly what it would look like when stagger3 is done.

    Just draw a picture of what the NetLogo window would look like after execution of stagger3 is done.

    Copy and Paste the NetLogo code into your NetLogo if you want to see what the output looks like and verify you figured it out.

  13. to stagger3
       ca
       cro 15
       ask turtles 
           [ ifelse remainder who 3 = 0      
    
                  [ fd 5 wait 0.1]                ; the remainder was 0
    
                  [ ifelse remainder who 3 = 1    ; remainder was NOT 0
                                  
                          [fd 10 wait 0.1]    ; the remainder was = 1
                                 
                          [fd 15 wait 0.1]    ; the remainder was = 2 
                  ]
           ]
    end                        
    

  14. FLASH: Study Page for Flash bouncing ball model.

    See the application with the two bouncing balls. RED uses Ease In and Ease Out to be a better model and simulation. GREEN does NOT use any easing in or easing out. Green Ball moves at a constant speed.

    Example: The Flash bouncing ball with Ease In and Ease Out and without Ease In and Ease Out (not easing). What does the graph look like for EASE IN? For EASE OUT?

  15. The GAME OF LIFE NetLOGO model.