CS 1025 Computational Modeling and Simulation

Test Two Study Guide - Spring 2014 - Tuesday, April 22nd


  1. Ventana VENSIM questions and study guide: Be able to create the births, birth rate, population Vensim model and run it and produce table and graph of the births and population so you can tell what year births reach 500 or population doubled or tripled.
    Reading pages 1 thru 4 of Chapter Two PDF is all you will need to do to review simplest population model we started with.

    Constrained Growth population model. An island of rabbits that has a specfic carrying capacity. S-shaped growth instead of exponential growth.

    Growth Rate equation is:
    
         Growth Rate = Growth Rate Constant * (1 - Population/Carrying Capacity)
    
          or                                             Population
                       Growth Rate Constant * (1  -  -------------------)
                                                      Carrying Capacity
    Understand the effect of adding 
       a carrying capacity and how the above
          equation changes the simpler population model
              from EXPONENTIAL GROWTH 
                to growth graphed by an S-shaped curve.  
                     (See Fig. 1.3. Six shapes to represent dynamic patterns...)
    

  2. Gravity and simulating a Bouncing Ball in After Effects. Trigonometry and a couple other mathematical functions are used. Ride the waves (Sine and Cosine waves). Growth and Decay of Exponential functions. Time (but not in a bottle). PI as in PI r squared.

  3. VIP: Turtle Trigonometry Solution with help on how to approach most or all of the problems using the Ghostbusters i. ii. iii. step approach of i. Venkman, ii. Stantz, and Spengler.

  4. VIP: The Fall 2013 Test One Study Guide covers material we did NOT get to by our test one, but we have covered all of it since our test one.
    See especially #1 and #2 and #11 
         for the NetLOGO Game of LIFE model 
               concepts and 
                      sample practice questions from previous tests.
    
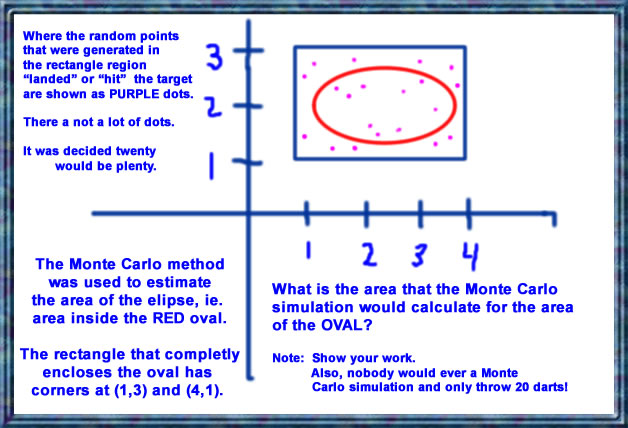
    See especially #3 on Monte Carlo throwing darts 
         to estimate the AREA of a region:
      i.
     ii.
    iii.                         b
     iv.                   a = ----- d
      v.                         c
     vi.


  5. What topics will be covered from the Spring 2014 Exam #1 Study Guide? Review and practice for ALL of them. Test #2 is comprehensive.

    1. Monte Carlo - review of Wednesday, November 14th, 2012 class. How to think about the known and the unknown and do algebra with the general formula. Dinosaur/Shark/Star Wars Fruit Snacks tossing solution to Area of the Contruction paper. Note: This was done in August 2013 with Star Burst candy cubes and two different size boxes.

                                 b
      Do you understand the a = --- (d) formula and concepts.
                                 c
       
      Can you look at a Monte Carlo problem 
          and find the a, 
                   the b,                         b
                   the c,                   The -----
                   the d?                         c
      
          and figure out which of the four parts is the goal, the unknown?
      
      It is all in the above study guide PDF.   See page CCC.  See CCC.
       
      BICTION = if the INK don' flow, the understanding don't grow.
        
      Take some notes, use some lead or ink, consume some scratch paper.
      Practice.  Don't just read over and look at.  DO!  Nike.  Just DO it.
      

    2. The Mystery Distance and Pythagorean Theorem 10/21 test one followup.

      Worksheet - Oct 21st midterm followup exercise 8 questions.

    3. SOH CAH TOA Trigonometry review/background for Turtle Trig and bouncing ball exercises. Sine, Cosine, Tangent.

      Turtle Trigonometry exercise. Heading, xcor, ycor, and turtle #1 having similar triangle to turtle #2.

    4. The Data Flyer application from SHODOR.
      Find the best fitting (smallest "Sum of squares of deviations:")
               line 
                    f(x) = mx + b
               
               for the following two points using Data Flyer:
      
                   -5 -1   <------ point a
                    0  3   <------ point b
      
      Now, REFRESH the Data Flyer application and try these three points:
      
                  -5   -1           point a  (same as before)
                   0    3           point b  (same as before)
                  -2.5  2           point c  <----- ths new 3rd point
       
           Can you get the Sum of squares of deviations: 0.67 or less????
      
           Note:  It is helpful to click on "Light Grid Lines" 
      
           When you get the 0.67 or less 
                for the Sum of the squares of the deviations, 
                after doing enough Change Function and Slider adjusting,
      
                you have discovered your 
                best fitting function 
      
                f(x) = mx + b, or
      
                  y  =  mx + b    What is m?   What is b?
      
      Know the idea 
           of the RISE                                                       
                       (the y2 - y1 or y difference 
                                              or distance or change)
          and 
              the RUN 
                       (the x difference, x2 - x2, 
                                            the x distance or change)
      
                    E                     E              R
                    S                    S               I
                    I                   I                S
                    R      or          R                 E
             R U N               R U N             R U N 
      
             Run across (the x-axis)    Rise UP (on the y-axis)
      
             Rise
            ------  =   slope of the line connecting the two points
             Run
      

    5. Ski slopes: Finding the SLOPE of a line given two points.

    6. Example: Using the Data Flyer tool to find the linear relationship between two variables (X = birth rate and Y = female life expectancy).

    7. Monte Carlo with NetLogo - 33 by 33 grid, Cows and Houses, not to be confused with cows in houses instead of barns!

  6. Monte Carlo concepts and problems. MonteCarlo20darts.pdf: Throwing 20 darts, throwing 100 darts, estimating area of an ellipse, estimating area A, B, C and D when a line is involved. y = mx + b. The line has slope m and intercept b.

    Netlogo TURTLES randomly scatter, then turn into either a COW or a HOUSE depending on whether they hit the BULLS EYE or missed the oval shaped bulls eye.


Monte Carlo concepts are on TEST TWO
Throwing Darts to determine an AREA.

MONTE CARLO QUESTIONS: Throwing Monte Carlo Darts or randomly scattering out turtles! :-)


  • Monte Carlo - given a diagram and graphical setup of an area, be able to determine what the area of below the function or between two functions is by using the Monte Carlo method.

    Know and understand the formula for coming up with a Monte Carlo estimated area when you know the proportion of or the actual count of "darts" that landed inside the area of interest.

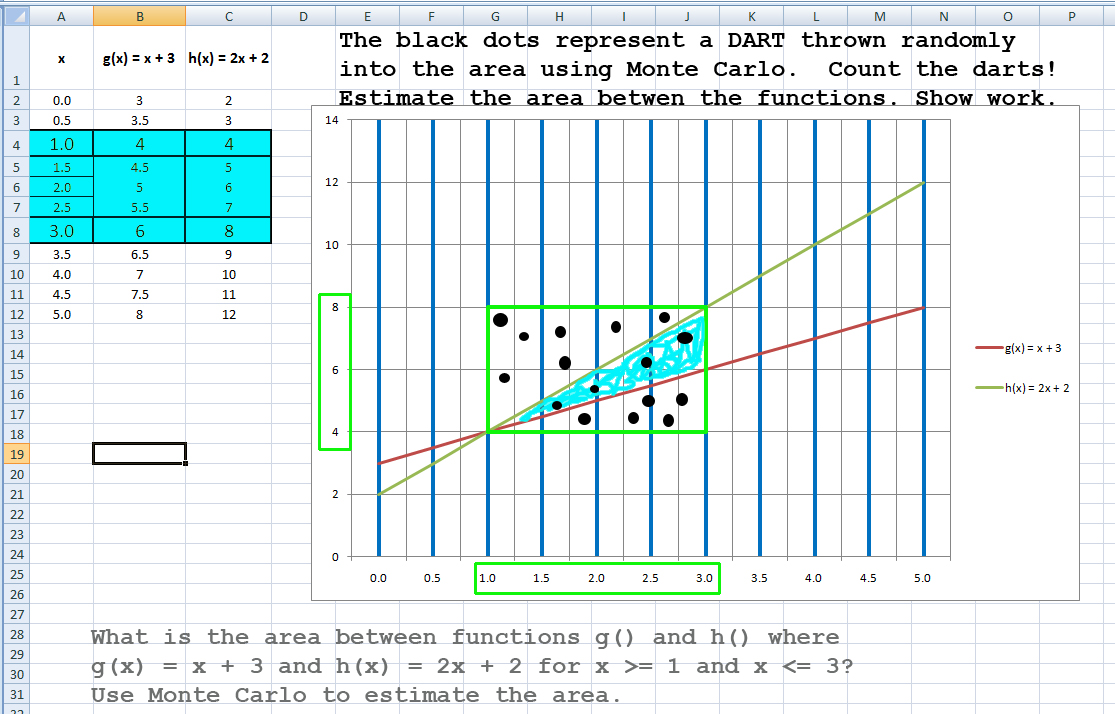
  • Example:  Look at the following diagram which shows a solid point for every dart that was thrown
              and where it hit inside the target area.  The target area is the rectangle there you see
              that goes from x = 1 to x = 3 and from y = 4 to y = 8.
               
              (Note: for practical purposes, only 16 or 20 darts were thrown 
                                                   in the examples shown here).
       
              Calculate what the estimated area of the region above function g 
                                                          and below function h would be?  (The area BETWEEN function g and function h).  
              Please show your work and calculations.
              I need to see your process of arriving at the result.
              You will get partial credit if your equation is correct, but you just had a simple calculation, arithmetic error.
              You will NOT get full credit for just having the correct answer, so show the process for that reason too.