Monte Carlo "Estimating the Area" Assignment
Assigned March 30th - due Thursday, April 8th, 2010


  1. Develop an Excel application that throws at least 100 darts randomly landing anywhere in a rectangular area of your choosing the includes the entire region between the functions f and g from x = 1 to x = 20. Note: (100, 500, 1000, 2000 darts) would all be okay choices.
  2. The following fall 2009 resource page for Excel Monte Carlo methods will be quite helpful. It is considered a prerequisite for doing your assignment.

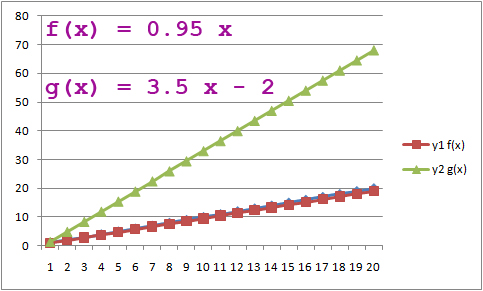
    Note: If you were in class on Thursday, March 25th, much of this material will already be very familiar. Review it anyway to ensure you understand the current assignment. We did the y1 = 2.5 x and the y2 = 0.8 x functions, or f(x) = 2.5x and g(x) = 0.8x in class that day using the department's laptop computers (from the laptop cart).

  3. Notice in this assignment that f(20) = 19 and g(20) = 68. Suppose that randomX is 20, for a specific example. What does that mean for the randomY that was also generated? If the randomY is greater than 19 and is less than 68, the random dart landed between the two functions.
  4. Note that f(10) is 9.5 and g(10) is 33. See the above screen snapshot. If randomX was 10.0 then we would have any randomY >= 9.5 that is also <= 33 as being a "DART" that hit the target.
  5. Would it be okay to work with a rectangle that is 20 in width and 70 in height, instead of being 19 wide and 68 tall? It really does not matter here for this simple model. The proportion of "darts" that land inside of the 20 by 70 rectangle will generally be a SMALLER PROPORTION of the total number of darts thrown than if we randomly throw all darts to land inside the 19 by 68 sized region.
  6. Area of 20 by 70 rectangle is 1,400 units. Area of the 19 by 68 sized rectangle is 1,292 units.
  7. PLEASE READ THE FOLLOWING CHECKLIST OF WHAT TO TURN IN FOR THIS ASSIGNMENT! LI 8, LI 9, LI 10 and LI 11 describe the items that will be turned in as hard copies and as printouts.
  8. Turn in a printout of your Excel spreadsheet screen snapshot with the formulas showing. VIP: Please do NOT waste paper and print out 100 or 200 or 500 or 1,000 rows! I only need to see the first 10 or 15 rows with the FORMULAs showing.
  9. Turn in a printout of the Excel spreadsheet screen snapshot with the results showing. Each randomX and randomY point represents a point within the larger rectangle that you have decided to use as the enclosing rectangle.
  10. Both of the above printouts can come from one document. Use the PrintScreen or the Alt+PrintScreen technique to get your Excel worksheet on the windows clipboard. Then Paste the contents into a Word or PhotoShop or whatever type of document. You can crop the screen snapshot in either application. You will be shown how to CROP in Microsoft Word during the StudioIT 1 lab classes on April 1st and April 8th.
  11. Email your Excel workbook as an attachment to jacobson@cs.uni.edu also. Put Monte Carlo assignment in the Subject: line of your email note. Sign your FIRST NAME to the end of the email note, please. U aNd I = UNI = yoU aNd I. Feel free to address me by my first name and notice that all of my email notes are signed with only my first name.

  12. ...