
Assigned on Tuesday, April 8th, 2014
Due on Tuesday, April 15th, 2014
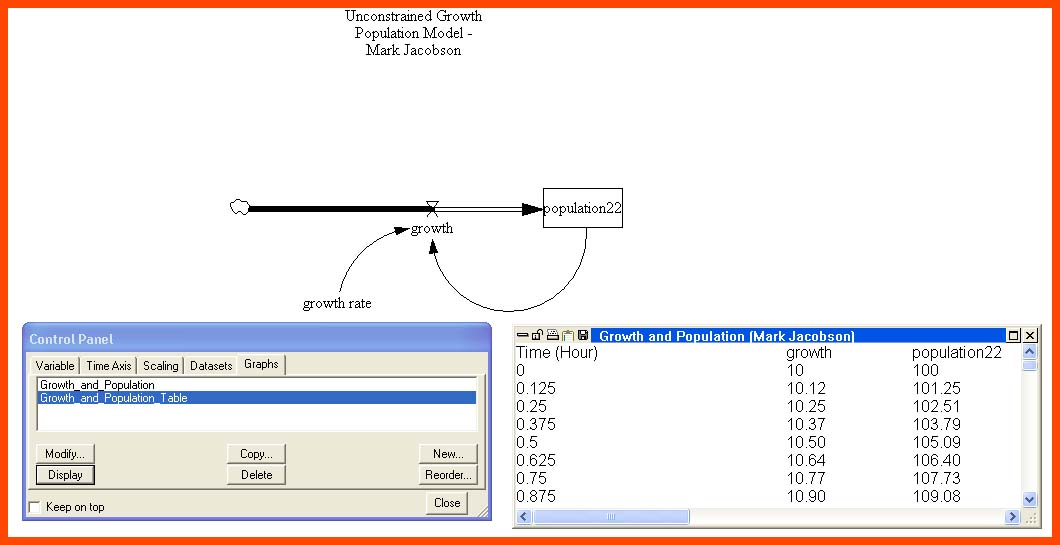
    Make sure the TABLE is RUNNING DOWN instead of across the page

    New option of showing the line widths at different thickness to make
        it easier to see which line is for which graph:

              Births - lineW 3   Deaths - lineW 1  Population - lineW 6

    Customizing the Y-axis Minimum and Maximum for the POPULATION

    How to have Births and Deaths share the same SCALE on the Y-axis.
                                                 -----
You can also send an attachment of the GRAPH and of the TABLE, that you have inserted (Copied and Pasted as shown in class) into a Microsoft Word document. If you have trouble with that, just print out the TABLE and the GRAPH or see me before or after class for help on that part.
Your graph and table will be of the births, deaths, and population. The TABLE does not have to include ALL of the rows. Just the first 5 or 10 rows and the last 5 or 10 rows would be enough. It should be clear from the assignment handout, which shows what my graph and my table looked like.
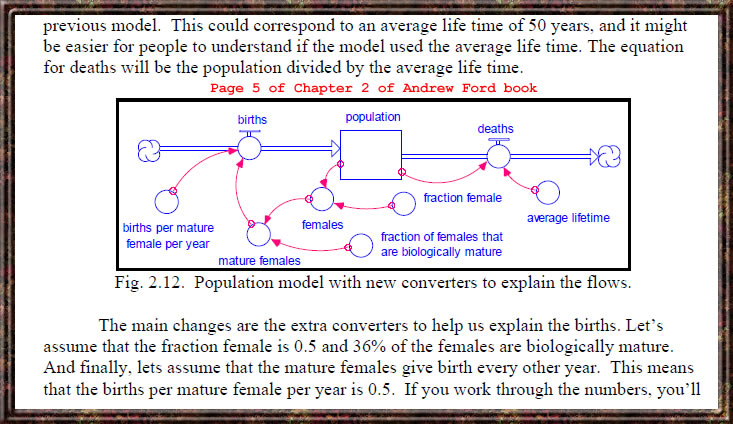