R Graphs assignment - Weeks 3 and 4 - Graphs
Chapter 4 - Exploring Data With Graphs


The assignment will be extended to Thursday 09/19 for the due date.
It will NOT be due on Tuesday.


  1. How to do LINE GRAPHS and ERROR LINE CHARTS for two independent variables.

                **** NEW as of 2:00 a.m. on Tuesday 9/17/2013...

  2. How to do BAR CHARTS and ERROR BAR CHARTS from DSUR book.

                **** NEW as of 4:30 pm 09/16 Monday...

  3. VIP: R Graphs Assignment help and suggestions for the scatterplot (lecturers/students, alcohol consumption and neuroticism).

  4. I used the file that is provided by Andy Field at the textbook web site. It has a problem in that it uses 1s and 2s, NUMBERS for the code for "Lecturer" and for "Student".

    That is WHY I created the vector variable names jobStr. See below here.

  5. You need to READ and DO the portions of the chapter that specifically prepare you for the Smark Alex's tasks on page 164. In chapter 3 is shows you how to ENTER THE DATA and save it. I would not have had the problem if I had done that instead of using read.delim() to get "C:/R/AndyField/Lecturer Data.dat" file into my workspace. ... along with its job variable being 1 1 1 1 1 2 2 2 2 2 instead of "Lecturer" "Lecturer" ... "Student" "Student". That is why I had to create and use jobStr!

  6. The following commands will help you understand Smart Alex's Task 1, part 5, the scatterplot graph. Study them in conjunction with the textbook example.


> lecturerData <- read.delim("C:/R/AndyField/Lecturer Data.dat", header = T)

> attach(lecturerData)

> names(lecturerData)
[1] "name"  "birth_date" "job"  "friends"  "alcohol"  "income"    
[7] "neurotic"  

> scatter2 <- ggplot(lecturerData, aes(neurotic, alcohol))

> jobStr
 [1] "Lecturer" "Lecturer" "Lecturer" "Lecturer" "Lecturer" "Student" "Student" 
 [8] "Student"  "Student"  "Student" 

 NOTE:  job variable is 1 1 1 1 1 2 2 2 2 2 and that WILL NOT WORK.
        It needs to be a STRING vector of "Lecturer" and "Student"
                                          values to work correctly.  
        That is WHY I made the jobStr vector used here!

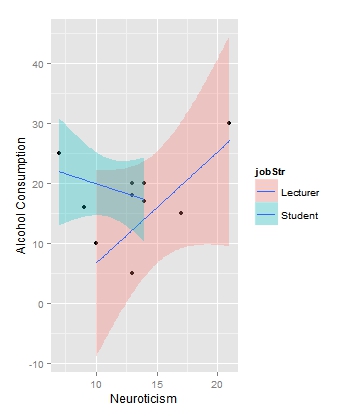
> scatter2 + geom_point() + geom_smooth(method = "lm", aes(fill =  jobStr), 
     alpha = 0.3) + labs(x = "Neuroticism", y = "Alcohol Consumption", 
     colour = "jobStr")

> alcohol
 [1]    10 15 20  5 30      25 20 16 17 18
> neurotic
 [1]    10 17 14 13 21       7 13  9 14 13
        --------------      --------------
         LECTURERS             STUDENTS
        --------------      --------------