> chickFlick <- read.delim("C:/R/AndyField/ChickFlick.dat", header=T)

> chickFlick

   gender                 film arousal
1    Male Bridget Jones' Diary      22
2    Male Bridget Jones' Diary      13
3    Male Bridget Jones' Diary      16
 ...

38 Female              Memento      31
39 Female              Memento      22
40 Female              Memento      14
> gender
Error: object 'gender' not found    <------- This is WHY...

> attach(chickFlick)                                 ---

> gender
 [1] Male   Male   Male   Male   Male   Male   Male   Male   Male   Male  Male   Male   Male   Male
[15] Male   Male   Male   Male   Male   Male   Female Female Female Female Female Female Female Female
[29] Female Female Female Female Female Female Female Female Female Female Female Female
Levels: Female Male

> names(chickFlick)
[1] "gender"  "film"    "arousal"
Is the package installed? Need to do install.package()
Is it installed already, but not loaded? library()
> bar <- ggplot(chickFlick, aes(film, arousal))
Error: could not find function "ggplot"

  Note: install.package("ggplot2") was NOT needed.  It was installed
                                                          3 days ago.
        library("ggplot2") command was all that was needed.
        library(ggplot2) works too.

        See page 121 of the DSUR book.

> library("ggplot2", lib.loc="C:/Users/Mark/Documents/R/win-library/3.0")

  Note:   library("ggplot2") is ENOUGH.
          The above syntax is what you get if you go to the Packages
              panel and check the unchecked checkbox for package ggplot2.

> bar <- ggplot(chickFlick, aes(film, arousal))
> bar + stat_summary(fun.y = mean, geom = "bar", fill = "White", colour = "Black")
  + stat_summary(fun.data = mean_cl_normal, geom = "pointrange")

Error : Hmisc package required for this functionality.  Please install and try again.

> install.packages("Hmisc")
Installing package into C:/Users/Mark/Documents/R/win-library/3.0 (as lib is unspecified)
     also installing the dependency Formula

package Formula successfully unpacked and MD5 sums checked
package Hmisc successfully unpacked and MD5 sums checked
> bar + stat_summary(fun.y = mean, geom = "bar", fill = "White", colour = "Black")
  + stat_summary(fun.data = mean_cl_normal, geom = "pointrange")
  + labs(x = "Movie", y = "Mean Excitement from watching sample of film")

> bar + stat_summary(fun.y = mean, geom = "bar", fill = "Yellow", colour = "Black")
  + stat_summary(fun.data = mean_cl_normal, geom = "errorbar")
  + labs(x = "Movie", y = "Mean Excitement from watching sample of film")
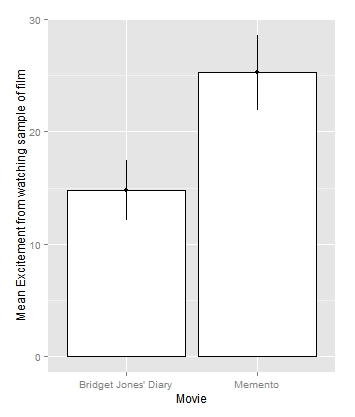
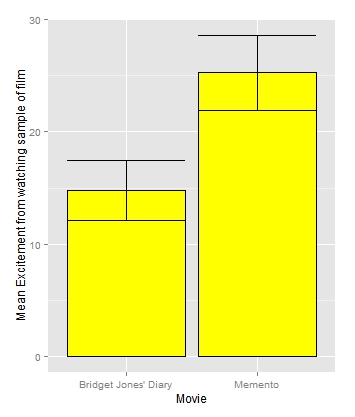
geom = "pointrange" is white graph on the left... ------------ ...geom = "errorbar" is yellow graph on the right...
> bar2 <- ggplot(chickFlick, aes(film, arousal, fill=gender))
> bar2 + stat_summary(fun.y = mean, geom = "bar")
The above command works, but the FEMALE bars are hidden
by the MALE bars.
> bar2 + stat_summary(fun.y = mean, geom = "bar" position="dodge")
Error: unexpected symbol in "bar2 + stat_summary(fun.y = mean, geom = "bar" position"
Oops, need a comma between each stat_summary() argument! , , ,
> bar2 + stat_summary(fun.y = mean, geom = "bar", position="dodge")
This works fine and the bars are side by side...
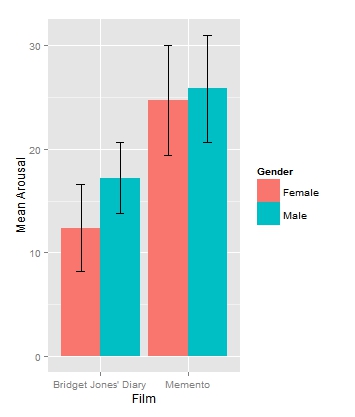
> bar2 + stat_summary(fun.y = mean, geom = "bar", position="dodge")
+ stat_summary(fun.data = mean_cl_normal, geom = "errorbar",
position = position_dodge(width = 0.90), width = 0.2)
+ labs(x = "Film", y = "Mean Arousal", fill = "Gender")
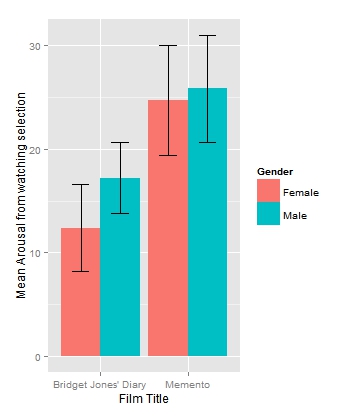
> bar2 + stat_summary(fun.y = mean, geom = "bar", position="dodge") +
         stat_summary(fun.data = mean_cl_normal, geom = "errorbar",
         position = position_dodge(width = 0.90), width = 0.4)
       + labs(x = "Film Title", y = "Mean Arousal from watching selection", fill = "Gender")